Metrics
Central Logging can track your application, server, or custom metrics.
It currently supports Counter and Gauge metrics scraped from the Prometheus metrics text format.
Set up a metric source
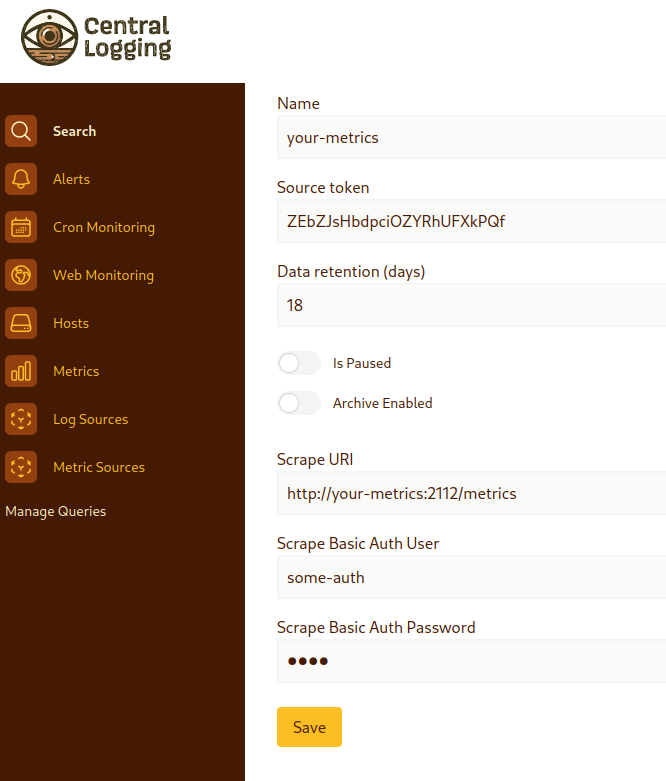
Click Metric Sources and create a new source by specifying the Prometheus URL to scrape with optional basic auth info:

Metrics
View available metrics from the Metrics page. Central Logging uses the same plotting library as Grafana. You get critical metrics features without the complexity of setting up a Prometheus/Grafana stack. There’s no need to setup data sources. Prometheus Counters (only increasing values) are made useful by automatically aggregated with rate(). For example: count/sec for 5m intervals.

💌 Get notified on new features and updates
Only sent when a new version is released. Nothing else.